by María Álvarez del Vayo / Civio
The share of Europe’s territory at high risk of fire has doubled in the last 50 years. But there are big differences between countries.
Portugal, Spain, Greece and Italy come up every year when we talk about major forest fires. You don’t have to look far back to remember catastrophes such as the fire in Rhodes, Greece, last July, that displaced 30,000 people. Or the Pedrógão Grande fire in 2017, in Portugal, that killed 66 people. The Mediterranean is a hot spot for climate change, and a hot spot for forest fires.
This article was originally published on civio.es
An increasing number of European countries are experiencing very high or extreme forest fire risk. This is a new problem for some of them. In recent years, forest fires have also become more severe in central, eastern and northern European countries. 2018 was a particularly bad year for Sweden. Sweden experienced very high fire weather risk, on average, in 49% of its territory that year, and extreme risk, the highest level, in 14% of its territory. This was a record for the last five decades. That same year, a record number of hectares burned across the country, far more than had burned in any year during the previous decade.
Europe now has twice as much territory at very high or extreme fire weather risk as it did in 1971: 40 percent, up from 20 percent. This means that populations that were not previously at high risk – or at all – are now at high risk of enduring a wildfire. This index, fire weather index, measures the weather conditions that enable a fire to spread. It incorporates humidity, wind, temperature and precipitation, but does not include other very important variables such as vegetation. To know the real fire danger, fire weather risk is only one part: “Part of it depends on the weather, part of it depends on the fuel and its flammability, which also depends on its moisture content,” says Carlo Buontempo, Director of the Copernicus Climate Change Service (C3S).
If we focus on fire weather alone, both its increase across Europe and in some individual countries suggest that it is becoming increasingly difficult to prevent potential forest fires. In fact, one research study points to the link between this increased risk and climate change. In the Mediterranean basin alone, the number of days with extreme risk has more than doubled in the last 40 years. The OECD report ‘Managing wildfires in the context of climate change’ states that: “Climate change exacerbates wildfire risk. Higher atmospheric temperatures, altered precipitation patterns, dryness of the landscape, and changing wind and lightning patterns have increased the risk of wildfires.”
It is not just that more and more territory with high fire weather risk or that the level of risk has increased over the years. These conditions also occur outside what the traditional summer fire season. “The duration of the fire weather season, which marks the annual period in which meteorological conditions are conducive to fire, is also on the rise in most areas of the world. On average, the duration of the wildfire season rose by 27% globally between 1979 and 2019”, according to the OECD report. In Catalonia, Spain, wildland firefighters are already observing this change. “It is like a de-seasonalization of the risk, which is no longer only in summer. There is also an increase in the number of [fire-fighting] services distributed throughout the year, also in spring,” says Etel Arilla, deputy inspector of the Forestry Action Group of the Catalan Fire Department (GRAF). In Poland, forest firefighters Przemysław Rembielak and Bartosz Klich tell a similar story: “The fire season is already extended, having been going on since February. With the lack of snow, the low, dry scrubs are burning then, when earlier in February or March there was still snow. Today, as we speak, it is October: two days ago, it was thirty degrees Celsius.”
The risk of wildfire is expanding
There are countries in Europe where very high weather risk of forest fire is rare. Switzerland, Norway, Ireland and Finland have had very little territory under this level of danger since 1971. Others, however, have seen more and more of their population at very high or extreme fire weather risk. Bulgaria, for example, has reached a level of more than 70% of its territory at very high or higher risk in 2022, compared to 23% fifty years earlier. The same is true for Belgium, France, Germany, Albania and Luxembourg, where the affected territory has risen from below 25% in 1971 to over 50% last year.
It is not only the population affected by this risk that has increased: there are also more days of very high weather risk in some European countries. In Albania, for example, fire weather risk is not only increasing the area it covers, but also its intensity. Central and Eastern European countries such as Hungary, Moldova, Romania and Serbia have had an increasing number of very high risk days over the last 50 years. There is a direct relationship between the increase in fire weather risk in Central Europe and the increase in wildfire activity in recent years, says a European Commission spokesperson. Biologist Ondřej Sedláček, from Charles University in Prague, explains about the situation in the Czech Republic: “There are greater extremes awaiting us. For example, there will be longer droughts, heat waves or stronger winds. The climatic conditions are therefore expected to be more disposed to forest fires”.
According to the European Commission’s Joint Research Centre (JRC)’s ‘Advance Report on Forest Fires in Europe, Middle East and North Africa 2022’, Romania had its worst year in 2022 in terms of area burned in the last decade, losing about 162,518 hectares to fires, more in proportion to its land area than burned that year in Spain. Most of these wildfires occurred during the month of March.
Very extreme risk in the Mediterranean
Until 2021, the Copernicus fire weather risk index (FWI) contained five categories: low, moderate, high, very high and extreme risk. Since June 2021, Copernicus added an additional level: “very extreme” risk, for FWI values above 70.
The Copernicus data covering 1971 and 2022 show that very extreme risk appeared years ago in parts of the Mediterranean but has been increasing since the turn of the century. Spain, for example, in 2022, broke its own record for the most territory at very extreme risk (55%). The same thing happened in Portugal, with 43% and in Greece in 2021, with 37% of the country at very extreme risk. “The very close link between extreme weather conditions and massive fires is more than evident. Confirmed climate change scenarios are increasingly predicting emergency situations throughout the Mediterranean: more intense and long-lasting heat waves, prolonged droughts and very low relative humidity,” according to a recent report by the World Wide Fund for Nature (WWF) in Spain.
Places outside Spain, Portugal, Greece and southern Italy, hardly ever record very extreme fire weather risk. France has also suffered from this danger in some years, although in small areas of the country. Ukraine in 2017 and 2018 had, on average, 3 days of very extreme risk in more than 30% of its territory. However, 14 of the 36 countries analysed have never experienced very extreme risk in the last five decades. These include Belgium, Switzerland, Ireland, the Netherlands, Lithuania and Sweden.
In an effort to predict wildfires in Europe, the European Commission in 2022 published a pan-European wildfire risk assessment, taking into account not only weather, but also vegetation and the risk of affecting inhabited areas. It classifies different areas of each country as high or low risk. This tool is especially important given “the potential increase of the risk due to wildfires in the Mediterranean-type climate regions due to climate change,” according to the assessment. In the temperature increase scenarios, the prediction models envisage “a marked increase is predicted of days with high-to-extreme fire danger in the Iberian Peninsula, Turkey, along with part of Greece and the Balkans, part of central and southern Italy, and of France”, according to an earlier, 2020 JRC report. In the worst-case scenario, with an increase of three degrees Celsius, in some areas such as south-eastern Spain there would be an increase of 40 days of high or higher fire weather risk, which could lead to even more devastating fires.
Investigation: María Álvarez del Vayo. Data and visualisation: Adrían Maqueda, Carmen Torrecillas. English editing: Lucas Laursen
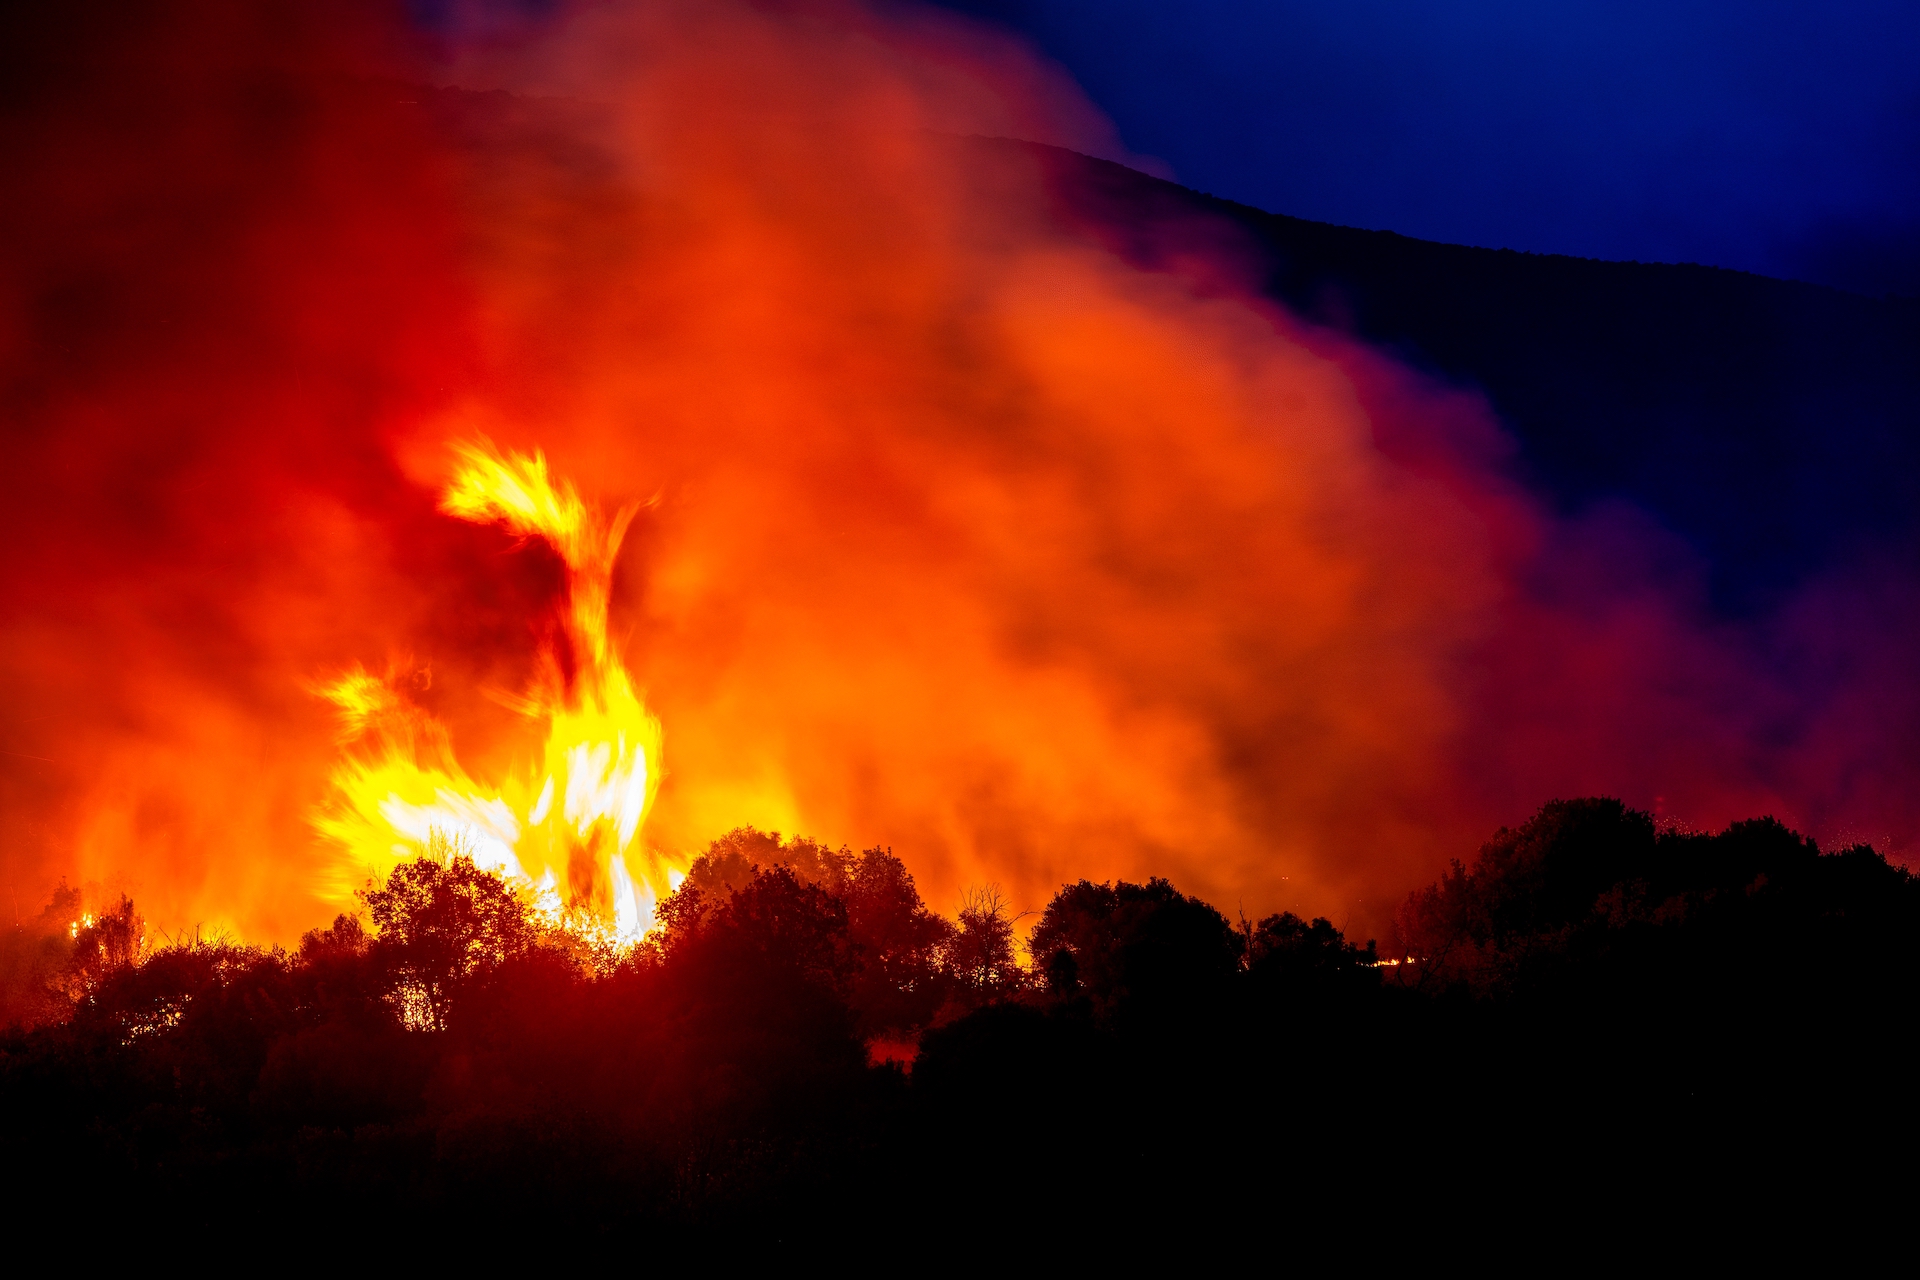
Cover photo: Forest fire in Alexandroupoli, Greece, August 21, 2023. Source: Ververidis Vasilis / Shutterstock
Methodology
For this report we have relied on historical fire weather risk index data from the Copernicus Emergency Management Service extracted from the Climate Data Store API on 25 July 2023. We chose to analyse the last 50 years of this index. In total 52 years have been analysed because we decided to start in 1971 to include the entire decade of the 1970s. Although there are data from 2023, we have not analysed them because they do not yet cover the whole year and are not comparable to other whole-year data. We analysed data from continental Europe excluding Russia and certain islands.
We cleaned and analysed the raw data, in NetCDF-4 format (a standard for scientific data exchange), using the R programming language through RStudio together with the packages tidyverse, giscoR and terra. We prototyped the visualisation in Observable and Plot, and finally developed it in Svelte using Javascript, D3 and Arquero.
What is the Fire Weather Index (FWI)?
The FWI is an index for estimating the risk of fire occurrence according to different weather values and is not directly related to intentional fire setting. The FWI starts at 0 and higher values indicate more severe weather conditions. It consists of different components that account for the effects of fuel moisture and wind on fire behaviour and fire spread. The higher the FWI, the more favourable the weather conditions are for triggering a wildfire.
How we have analysed the data
The original data provided by Copernicus have a cell size of 0.25ºx0.25º degrees. For the latitude corresponding to the Iberian Peninsula, the size of each point would be equivalent to 27.8 x 21.4 km (although those located further south would correspond to a larger area, and those further north, to a slightly smaller area), which we have approximated in the map legend to about 25km by 25km.
Once we downloaded the data, we read and grouped them with terra and then converted them into dataframes for analysis. To filter the downloaded data according to the spatial boundaries of Europe and each country we used giscoR maps.
All decisions regarding data analysis followed advice and guidelines from the experts we interviewed for the report.
We decided to focus the analysis on the “very high”, “extreme” and “very extreme” categories. The values for each category are determined by the European Forest Fire Information System (EFFIS) of the European Commission. Although the “very extreme” category was introduced in 2021, in this research we have used it retroactively for a better comparison.
To analyse the data for Europe while maintaining the extreme values that occur throughout the territory, we have not averaged all the data but have calculated the percentage of the territory, calculated as the number of affected cells out of the total, for each category. In this way we did not alter the original data, which by their nature are not intended for certain temporal or spatial analyses.
First, we calculated for each day of the year the category of each cell and filtered to keep only those cells that were in categories of interest. We then calculated for each year the number of days on which each cell in the categories of interest. This is the data displayed on the interactive map.
To give an overview of Europe and the different countries in each year, we calculated the percentage of territory spent at least one day in each category and the median number of days in which these cells were in each category. These are the data visualised in the radial graph of percentages.
Once we had performed the calculations for Europe and for each country, we exported them to comma-separated values (.csv) files. You can download the data at Civio Data.
In addition to the data mentioned above, to check the hypotheses of this report, we carried out different interviews with experts and other data analyses. We have not included them all in this report due to their complexity in terms of communication and to avoid burdening the report with excessive data. Among others, we have calculated the increase of extreme values in Europe with respect to the reference period of 1991 to 2020, the seasonality of the data, and the variation of the data by decade.
Visualisation
To develop the interactive visualisations, we explored the data with Observable and Plot, after which we decided to develop our visualizations in Svelte, using Javascript, D3 and Arquero to finish cleaning the data and adapt them to the needs of each plot. For example, with these libraries we obtained maximum values for the scales and filtered the global data to adapt them to each year and province selected.
When users select a province, the cells that make up that region are highlighted. In the case where a cell is part of several provinces, only the one in which the centre of the cell is located within its geographical limits is highlighted.
All graphics have been made with SVG, except the map points, which are in Canvas to optimise performance. For this we have adapted the method used by Der Spiegel in their visualisation of Nobel Prize winners, which can be found in this GitHub repository.
We would like to thank Dominic Royé, PhD in Physical Geography, researcher at the Foundation for Climate Research; Pampa G. Molina, director of Science Media Centre Spain; Francesca Di Giuseppe, manager of ECMWF’s Fire Danger Forecasting service; and the Joint Research Centre of the European Commission for their help in producing this report.
This research has been made possible thanks to the European Data Journalism Network (EDJnet).
EDJNet is a network of media organisations from all across Europe, producing and promoting data-driven coverage of European issues. FRONTSTORY.PL is a part of this network.


